A 0-to-1 Launch That Expanded TAM 5x
Price Image Management launched in 2017 as Engage3's entry into the $65B retail price optimization market. It expanded the company's total addressable market 5x, helped attract the venture interest behind Series C and Series D, and I owned it as lead PM from first customer interview through six-plus years of production evolution.
The bet
Our customers had already bought price optimization tools from our competitors, and they hated them. Interviews with every client who'd invested in the category surfaced four consistent failures: garbage-in-garbage-out third-party data, opaque rules-based engines, 8 to 12 month implementations before any value, and optimization for short-term profit at the expense of loyalty.
The bet: Engage3's differentiated data collection plus its data science investments could beat incumbents in a saturated market. That was also the riskiest assumption, so it's what we tested first.
How we de-risked it
Validated the problem before the solution. A 24-question interview script co-written with our head of data science; every price-optimization customer interviewed within a month. The findings drove both data-model and UX decisions for the life of the product.
Cut scope by persona, ruthlessly. Four personas emerged; we built the MVP for two (Category Managers and Chief Merchandising Officers) and said no to the rest until post-launch. For a data-rich product, this is the difference between an MVP and a two-year science project.
Tested the riskiest assumption at V0.0.1, in Excel. Before any software existed, we ran experiment designs in spreadsheets with real market data: simulated price strategies, margin and profit curves, competitor pricing scenarios. Only after the data science proved out did we move to wireframes, an InVision prototype, and a hired UI designer for the high-fidelity MVP.
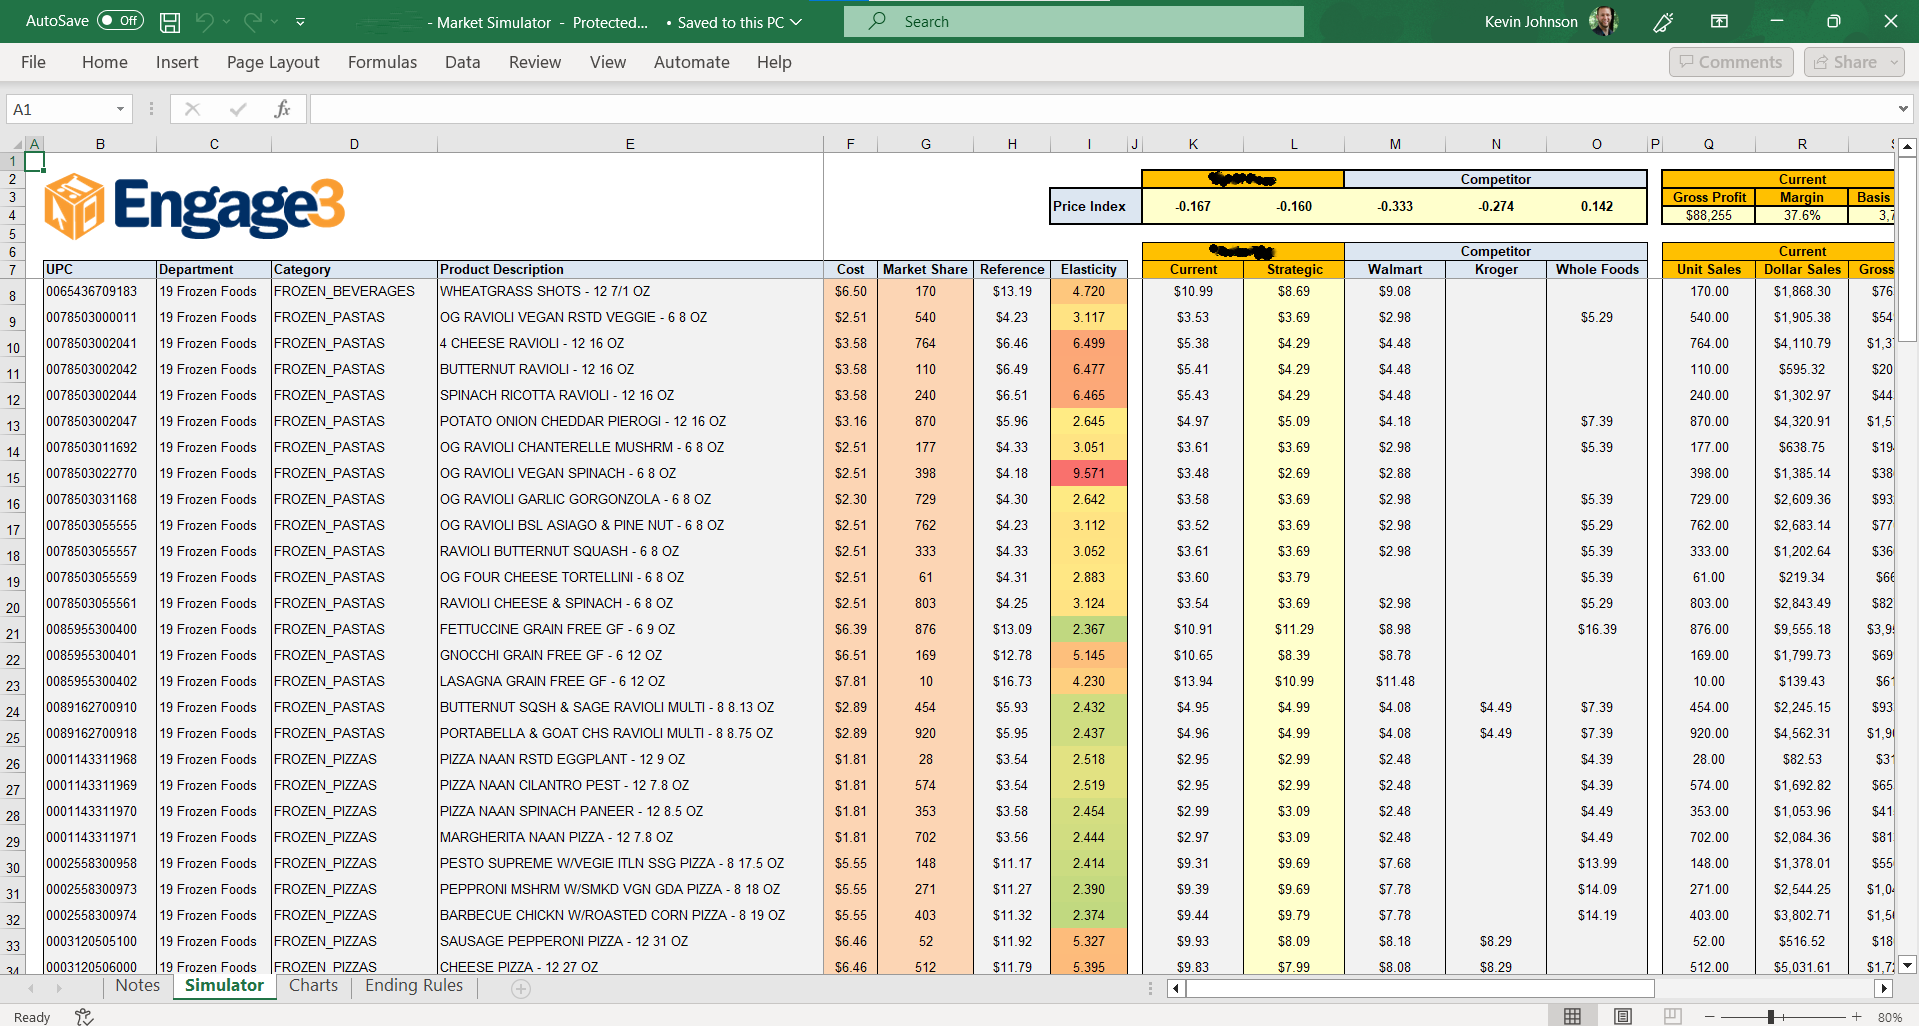
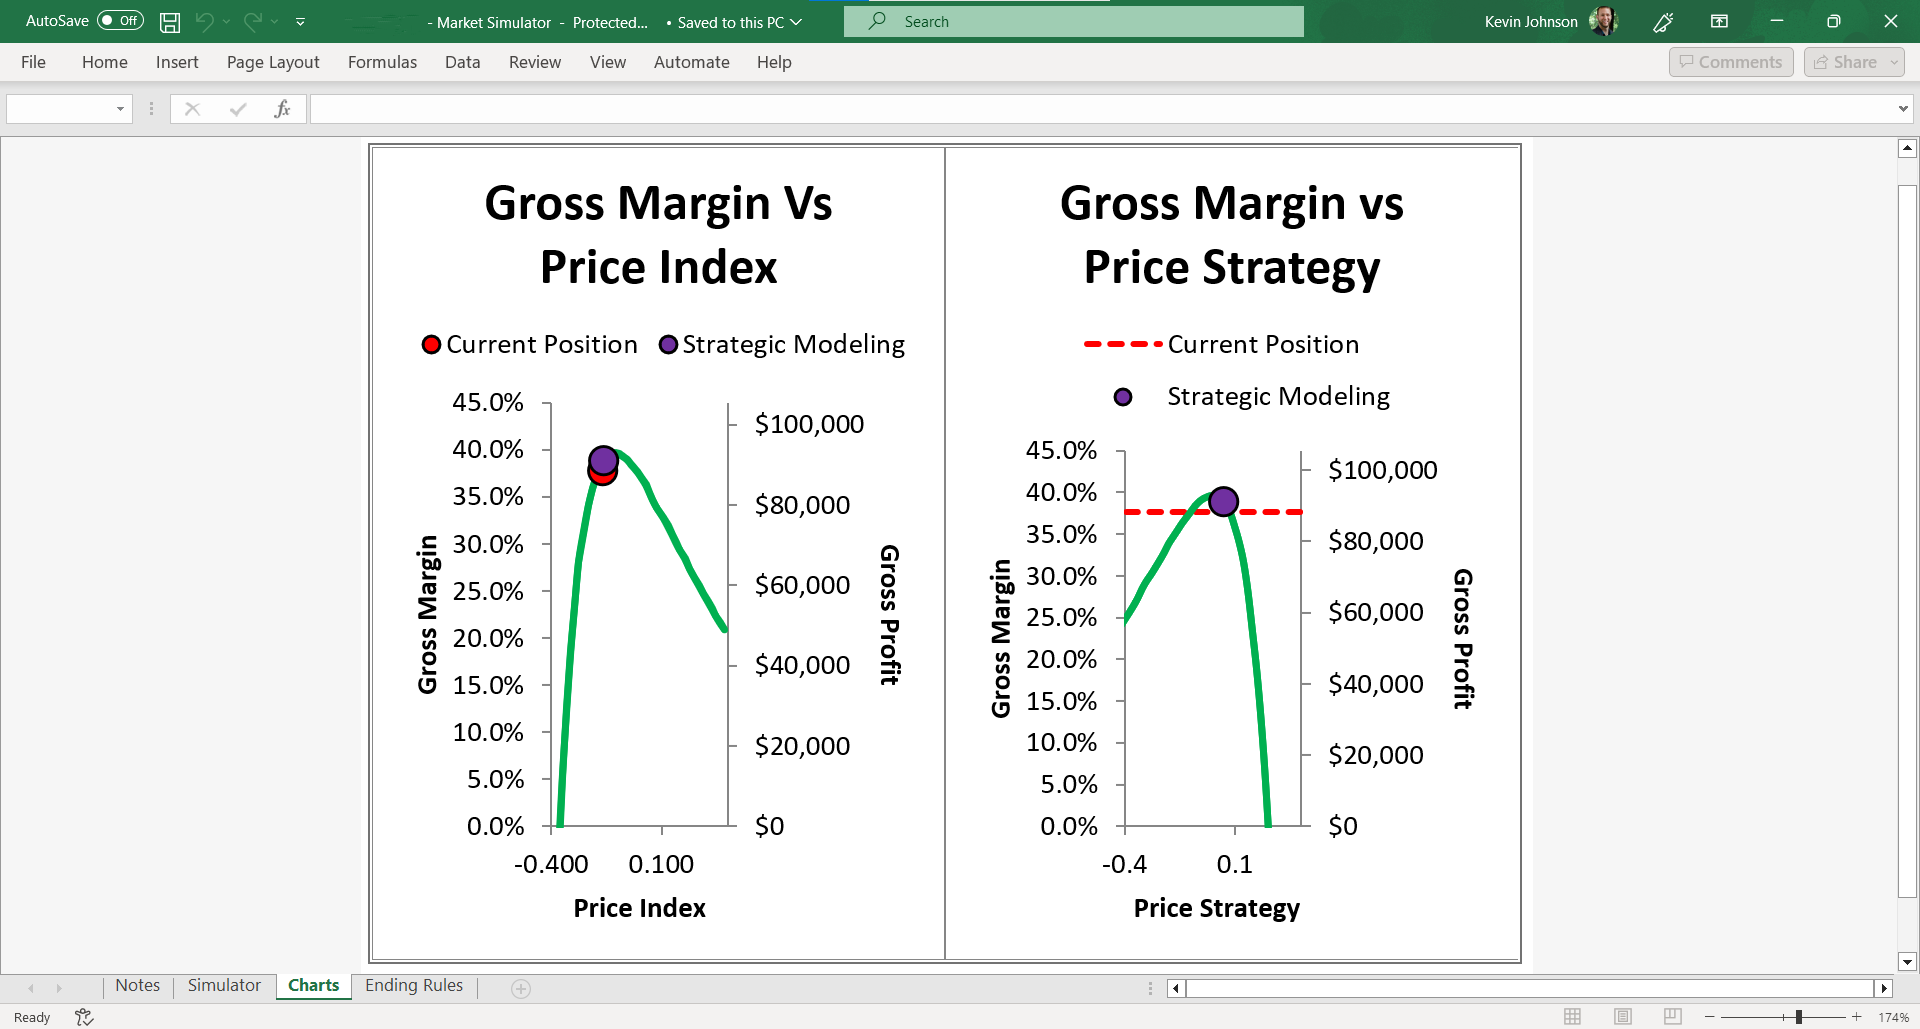
Timeline: roughly 2 weeks of discovery, 8 weeks of experimentation and validation, 8 weeks of design and MVP build.
Results
- 5x TAM expansion for the company
- Contributed to Series C and Series D fundraising
- Six-plus years in production, evolving from "Competitive Price Response V0.1" to a core module of the platform serving major retailers
What I'd do differently
Kill the black box sooner. PIM wasn't a me-too optimizer. The concept, conceived by our CEO (who had founded the original price optimization company), modeled which products actually drive a retailer's overall price image, incorporating factors traditional optimization ignored, including consumer psychology. That sophistication was the differentiation, and it was also the trust problem.
For too long, the product's posture was: here are the factors in our model, here are your optimal prices, trust us. My hunch at the time, which I'd act on a hundred times harder today, was that we needed to educate users inside the product itself. Overexplain the how. Make the methodology and the data behind every recommendation visible at the point of the recommendation. We were asking merchants to override 30 years of pricing instinct with a number they couldn't interrogate, in a market already crowded with tools that had burned them. The black-box period cost us traction we should have had earlier.
What six years of ownership taught me
The scientific method isn't a discovery-phase ritual. It's the operating system: every assumption stays visible and gets relentlessly validated, or it quietly becomes a liability. And essentialism wins. Nearly everything that went wrong traced back to scope we should have cut; nearly everything that worked came from saying no earlier.
← All case studies